Two Exceptional Deer Creek School Homes on Premium Acre Lots in Edmond
Looking for move-in ready luxury and thoughtful design in one of Edmond’s most coveted school districts? We’ve got two incredible opportunities built by Lorenz Heritage Homes in Deer Creek’s Addington Farms that deserve a closer look — whether you’re upsizing, downsizing, or seeking your forever home.
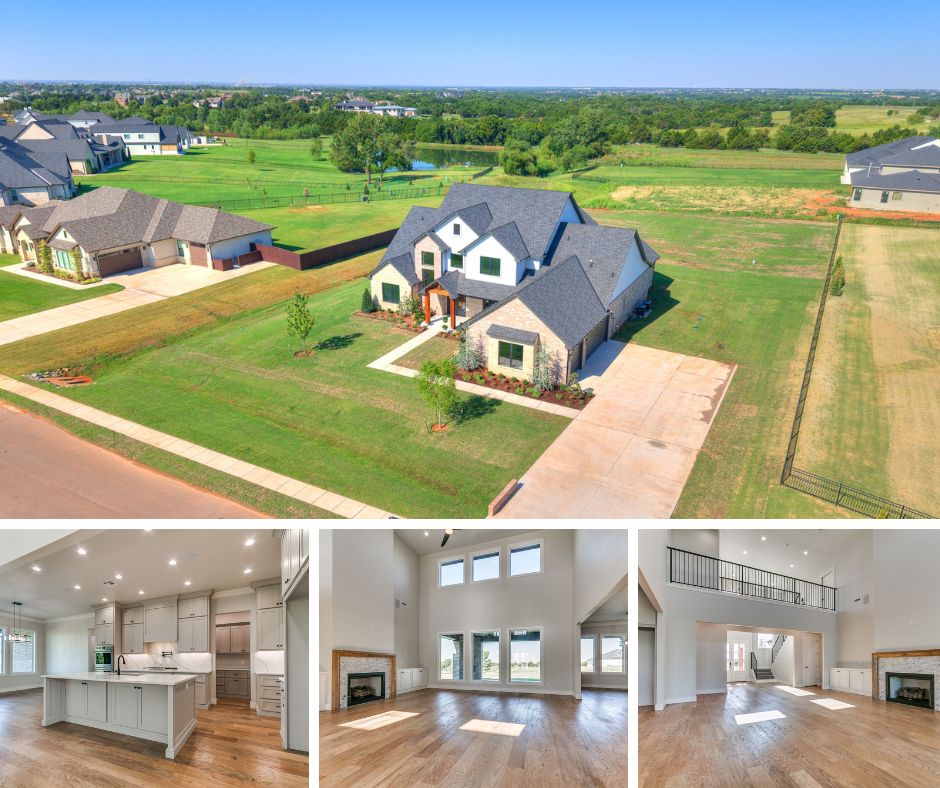
$888,800 | 5 Beds • 4 Baths • 3,260 sq ft
MLS #1200418
This stunning all-one-level home redefines comfortable, sophisticated living. Set on a full acre in the highly regarded Deer Creek school district, it’s ideal for families that want both space and style without stairs.
What Buyers Will Love:
- Every bedroom with its own bathroom — privacy and convenience for family and guests alike.
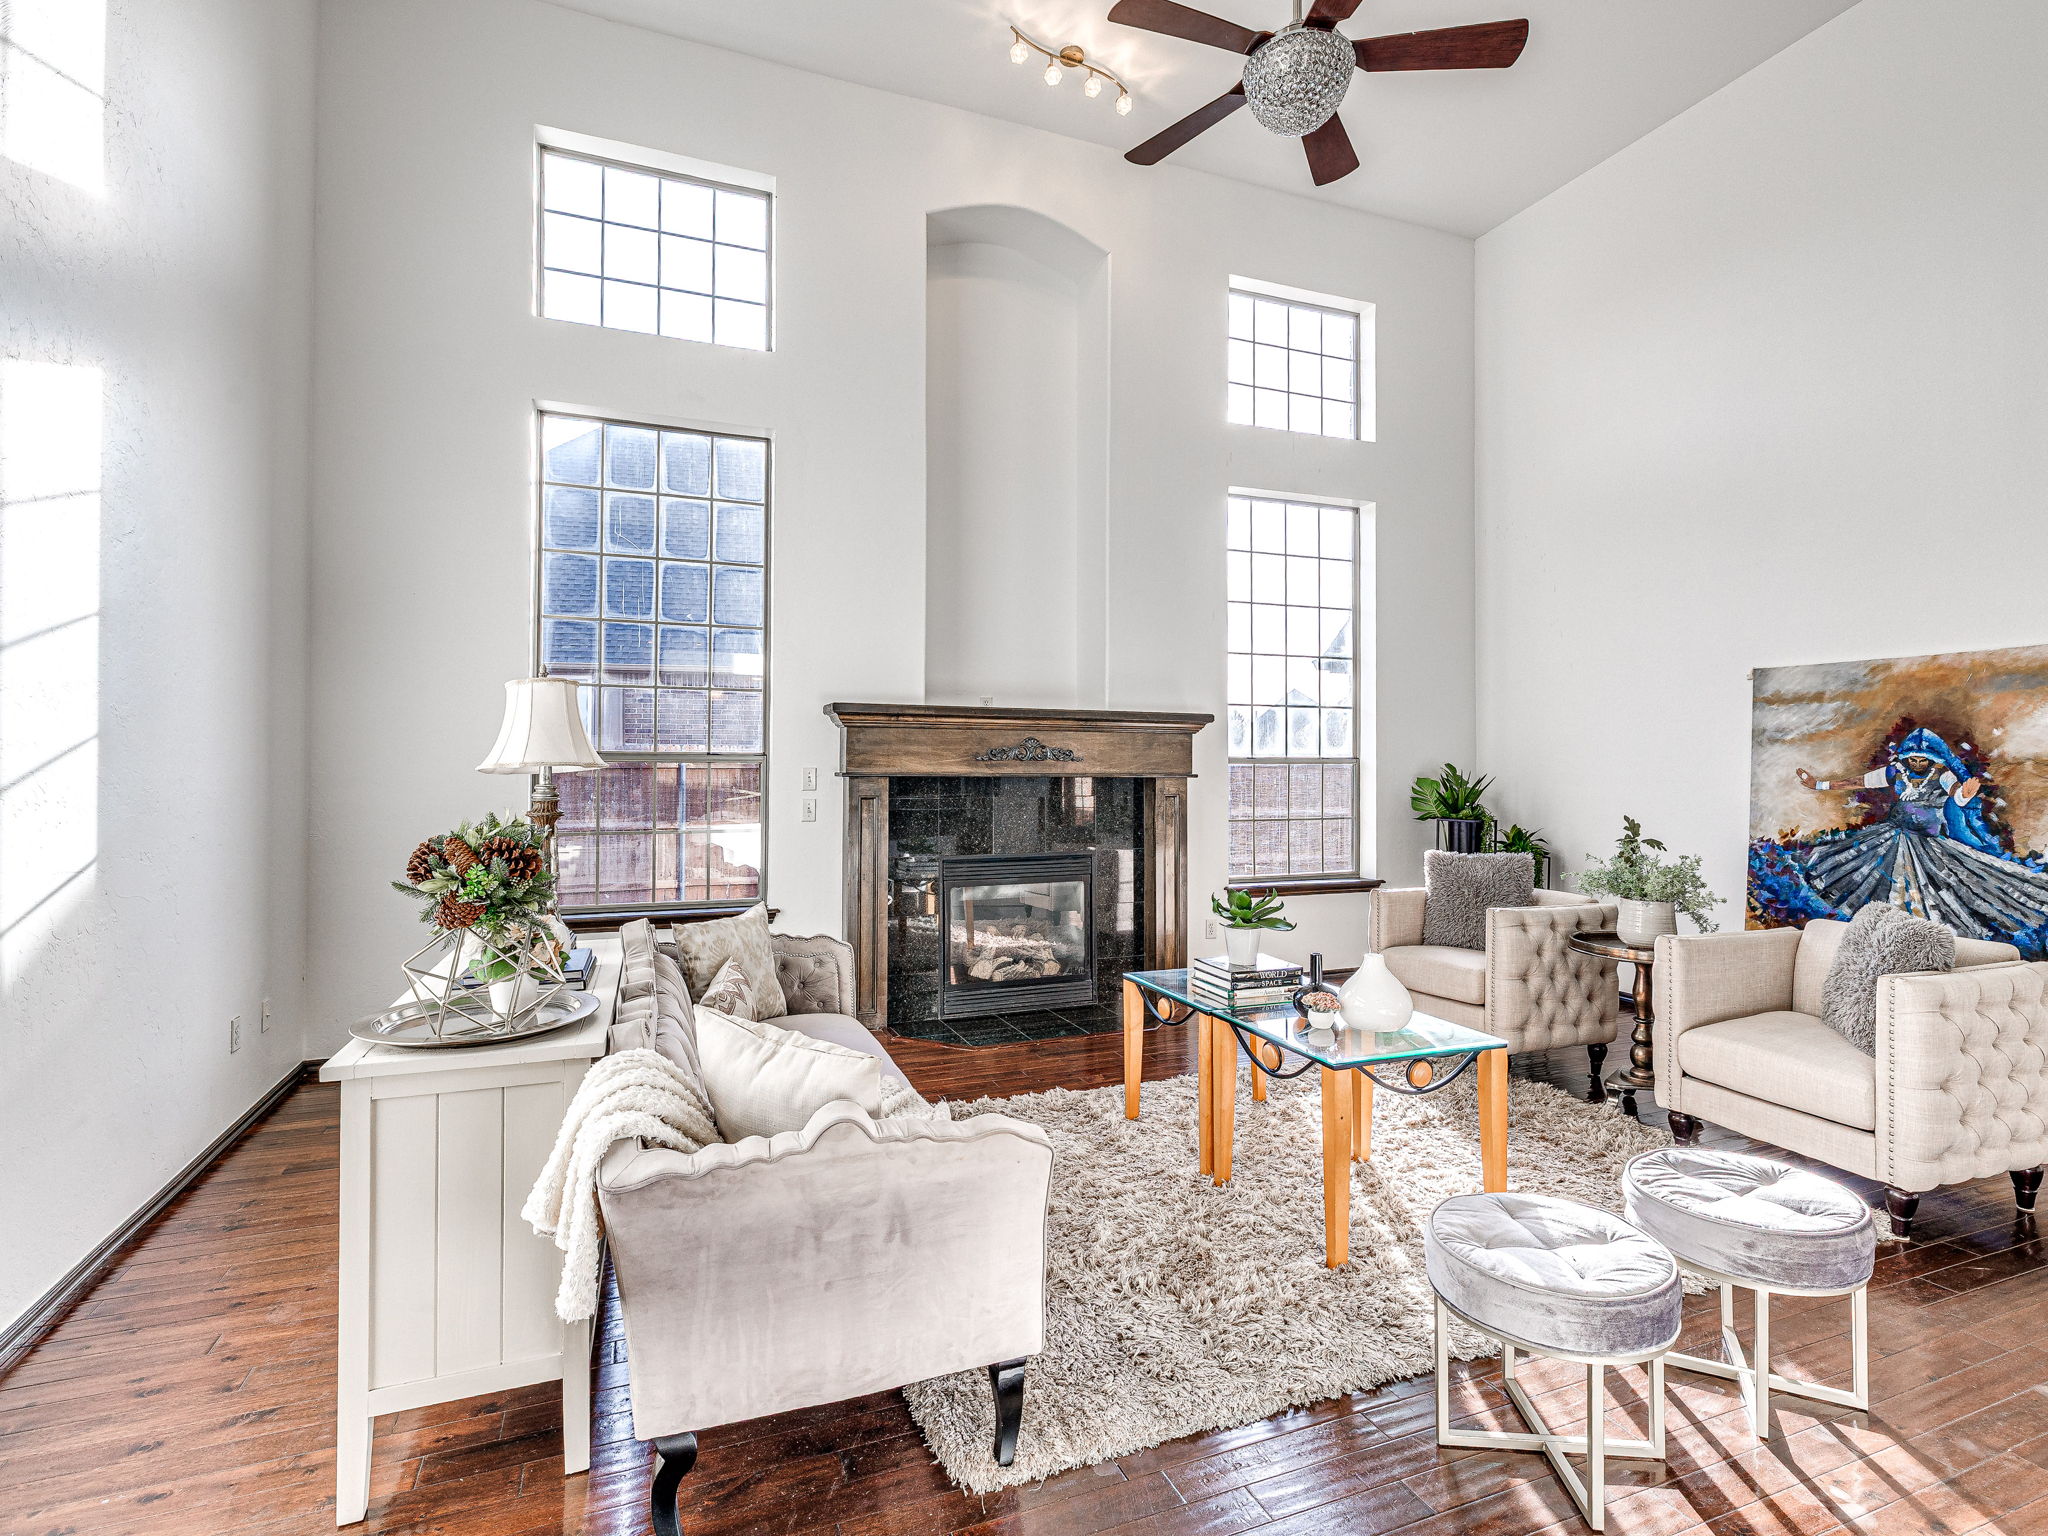
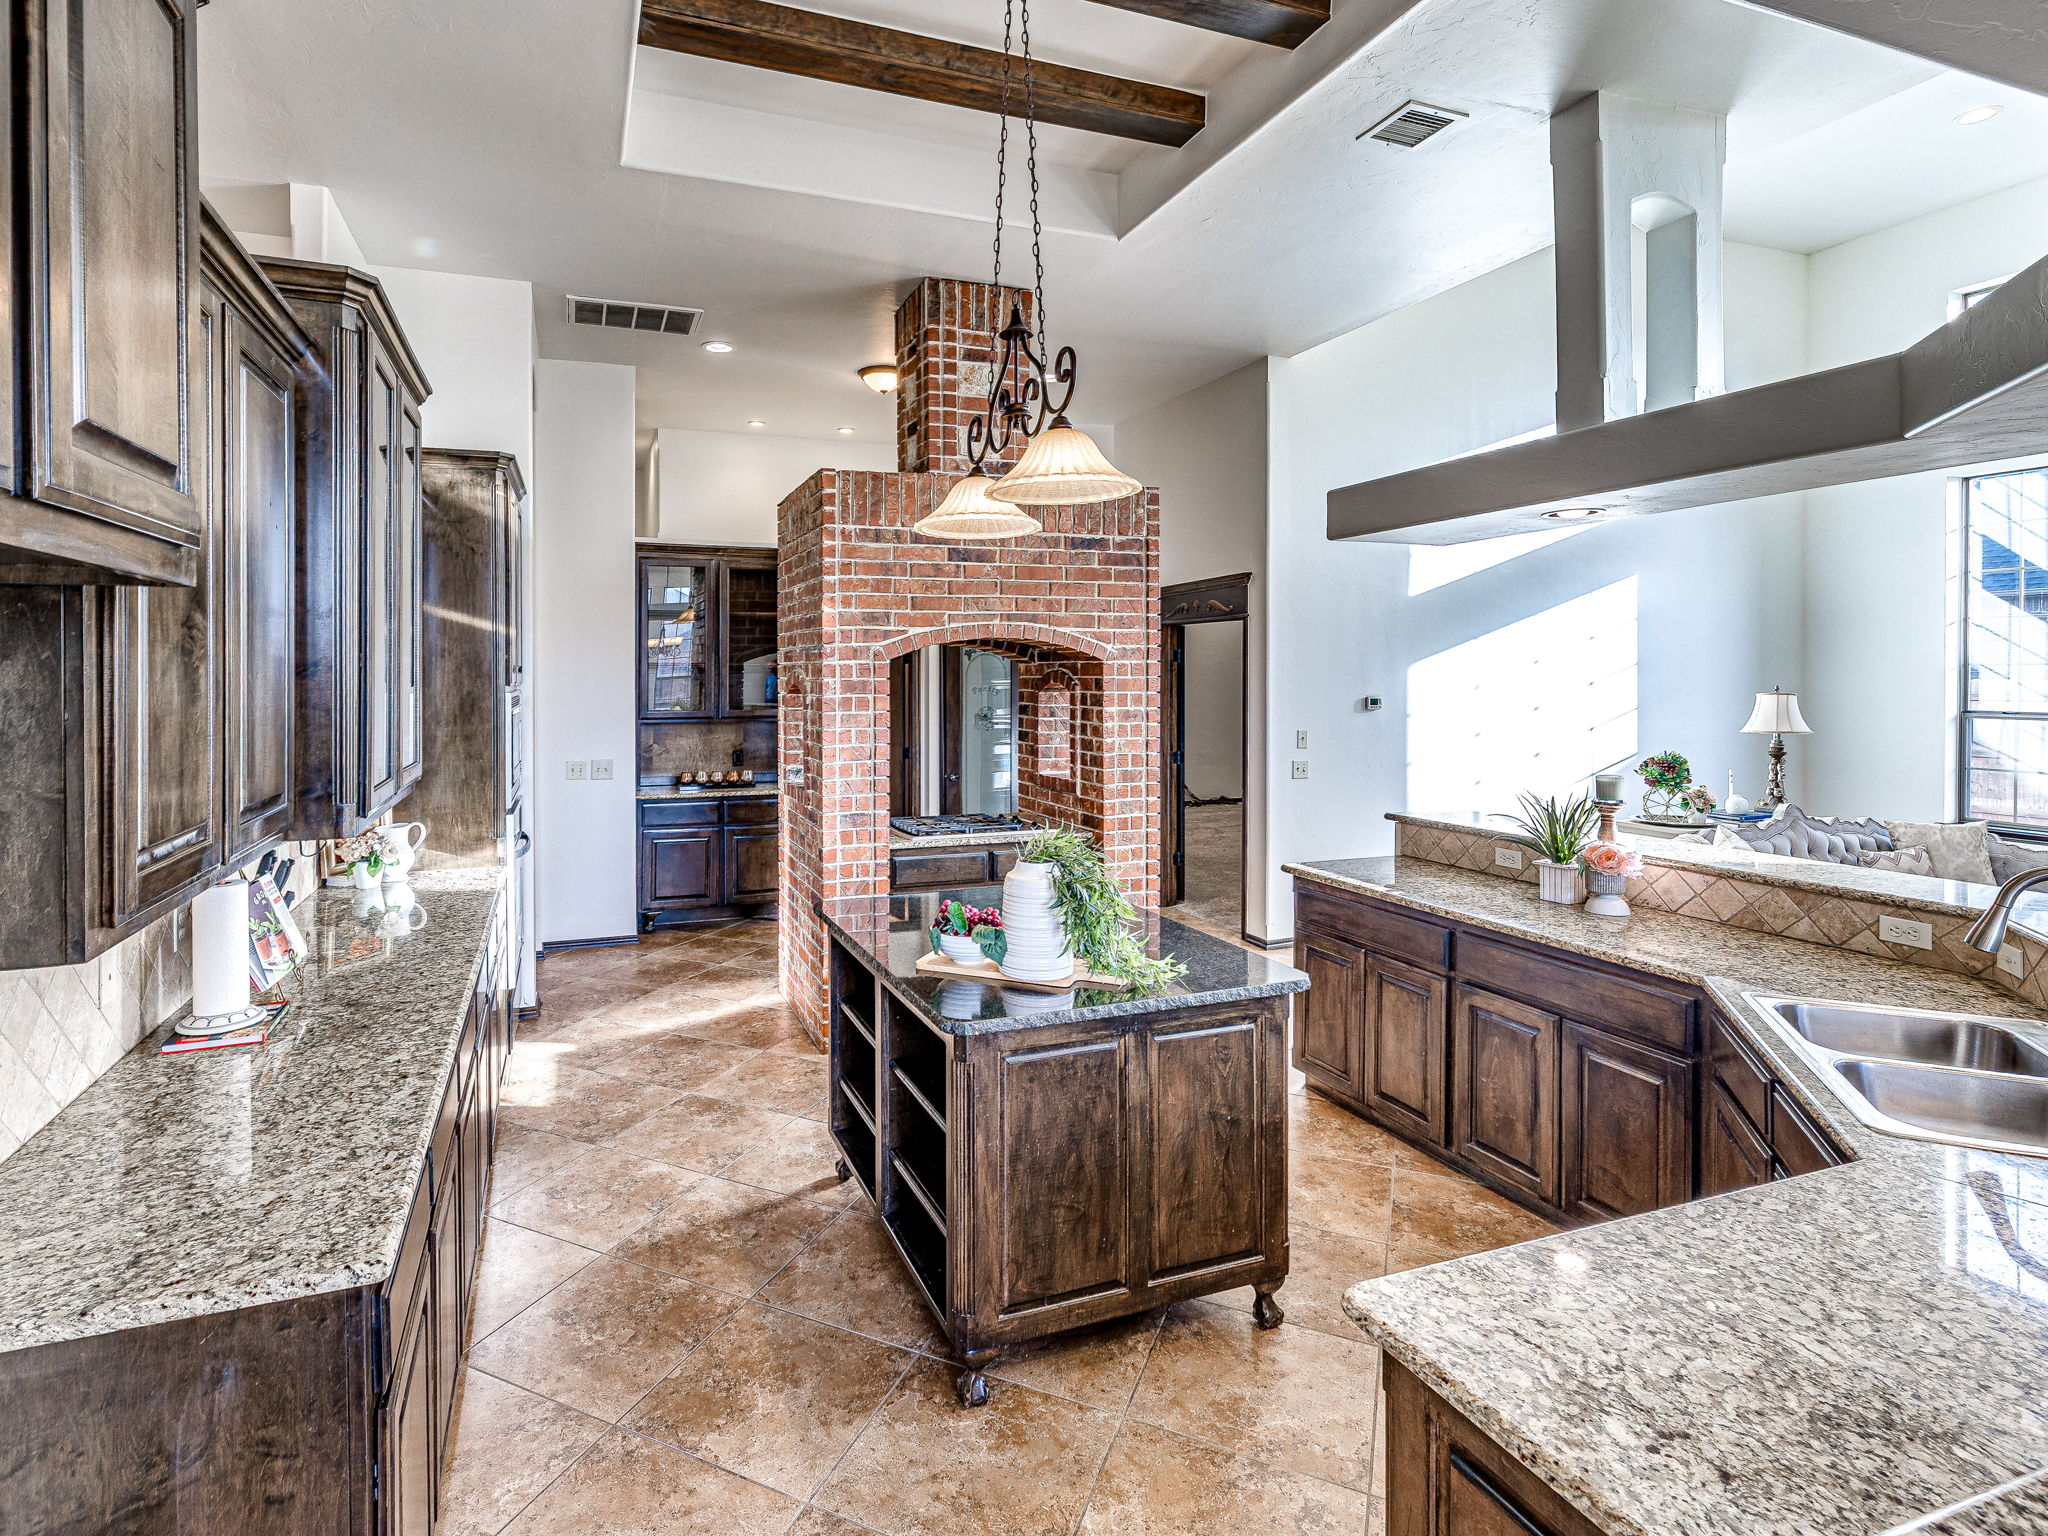
- Gourmet chef’s kitchen with custom wood cabinetry, double ovens, gas cooktop with pasta faucet, and a sprawling 84 sq ft butler’s pantry — perfect for entertaining.
- Expansive game/flex room — ideal for a home theater, play zone, or lounge space.
- Bright living spaces under vaulted ceilings, anchored by a cozy gas-log fireplace and elegant built-ins.
- A dedicated study for remote work or reading.
This thoughtfully crafted plan balances flow and function while maximizing everyday comfort — all on a private acre with room to stretch out and play.
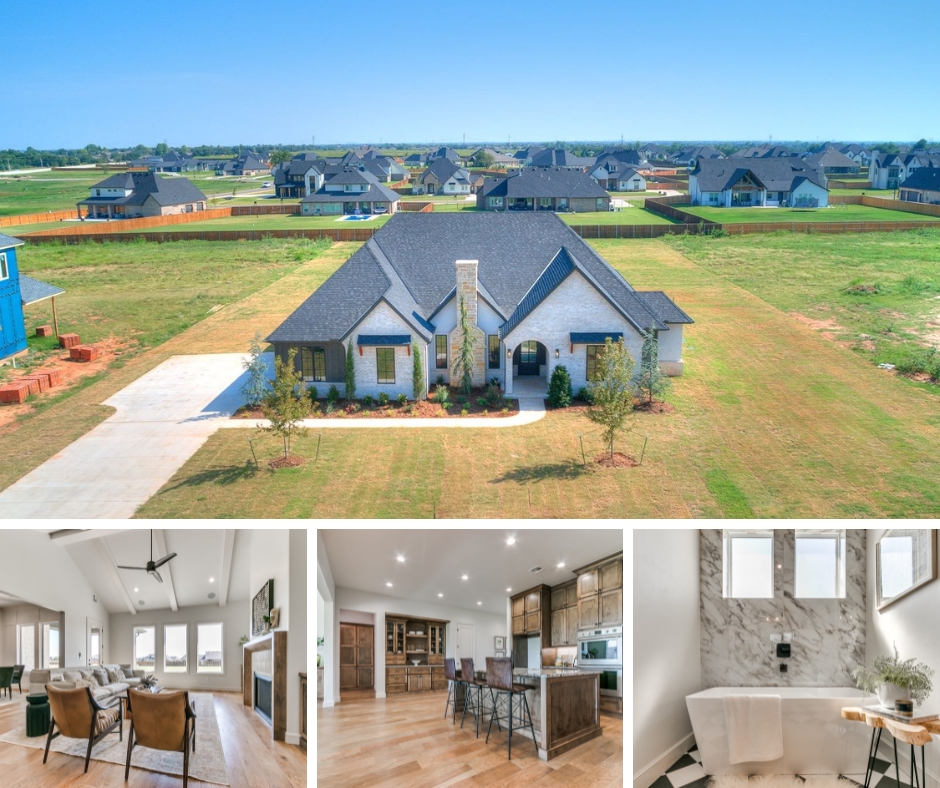
🏠 22645 Forester Lane — Architectural Impact + Entertaining Flair
 $1,135,000 | 4 Beds • 4.5 Baths • 3,902 sq ft
MLS #1187299
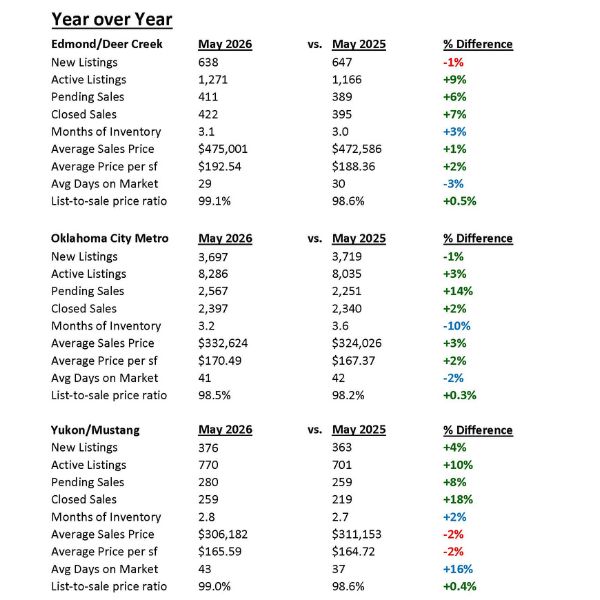
If you’re drawn to dramatic design and high-end details, this striking Deer Creek home delivers. With two-story ceilings, expansive windows and a custom floor plan, it’s built to impress from the moment you step inside.
Standout Features:
- Grand two-story living room with gas-log fireplace and 20′ ceilings — an entertainer’s dream.
- Rich white oak hardwood floors throughout the main living areas.
- Chef’s kitchen with double ovens, gas cooktop, pot-filler, and walk-in butler’s pantry.
- Elegant study with built-ins and French doors for a private home office.
- Luxurious primary suite with vaulted wood-beam ceiling and spa-like bath featuring a freestanding tub and oversized walk-in shower.
- Outdoor living with covered patio and fireplace overlooking a peaceful pond — no rear neighbors.
From architectural interest to practical upgrades like hybrid insulation for energy efficiency and comfort, this home blends beauty with modern performance.
🗝 Why Buyers Love Addington Farms & Deer Creek
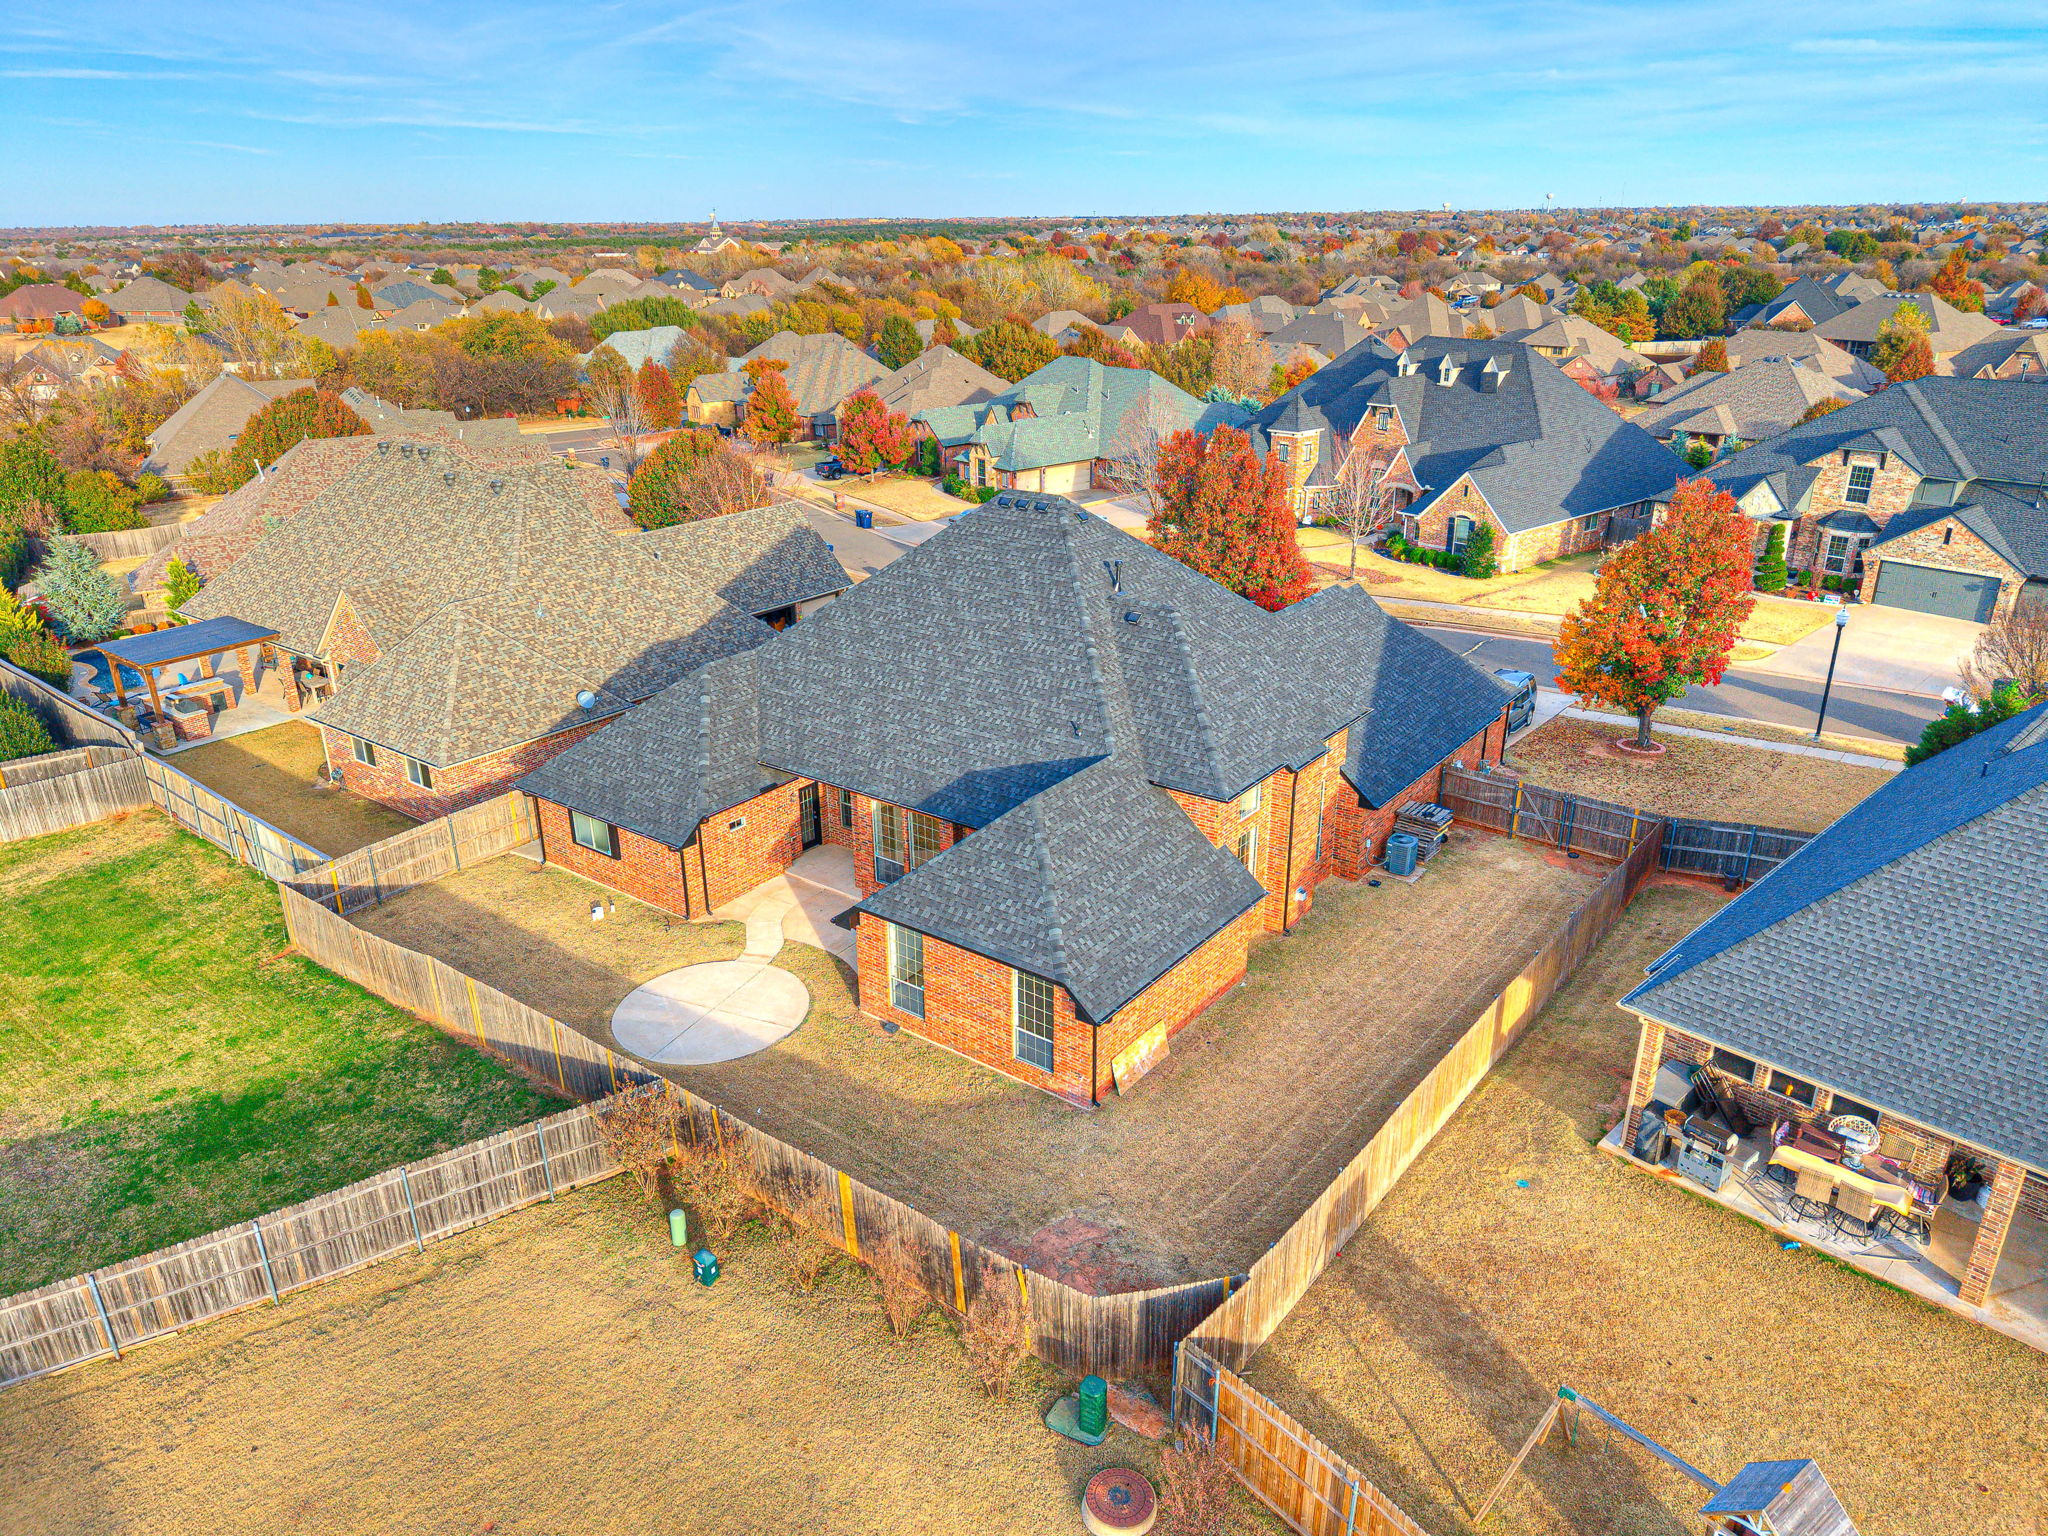
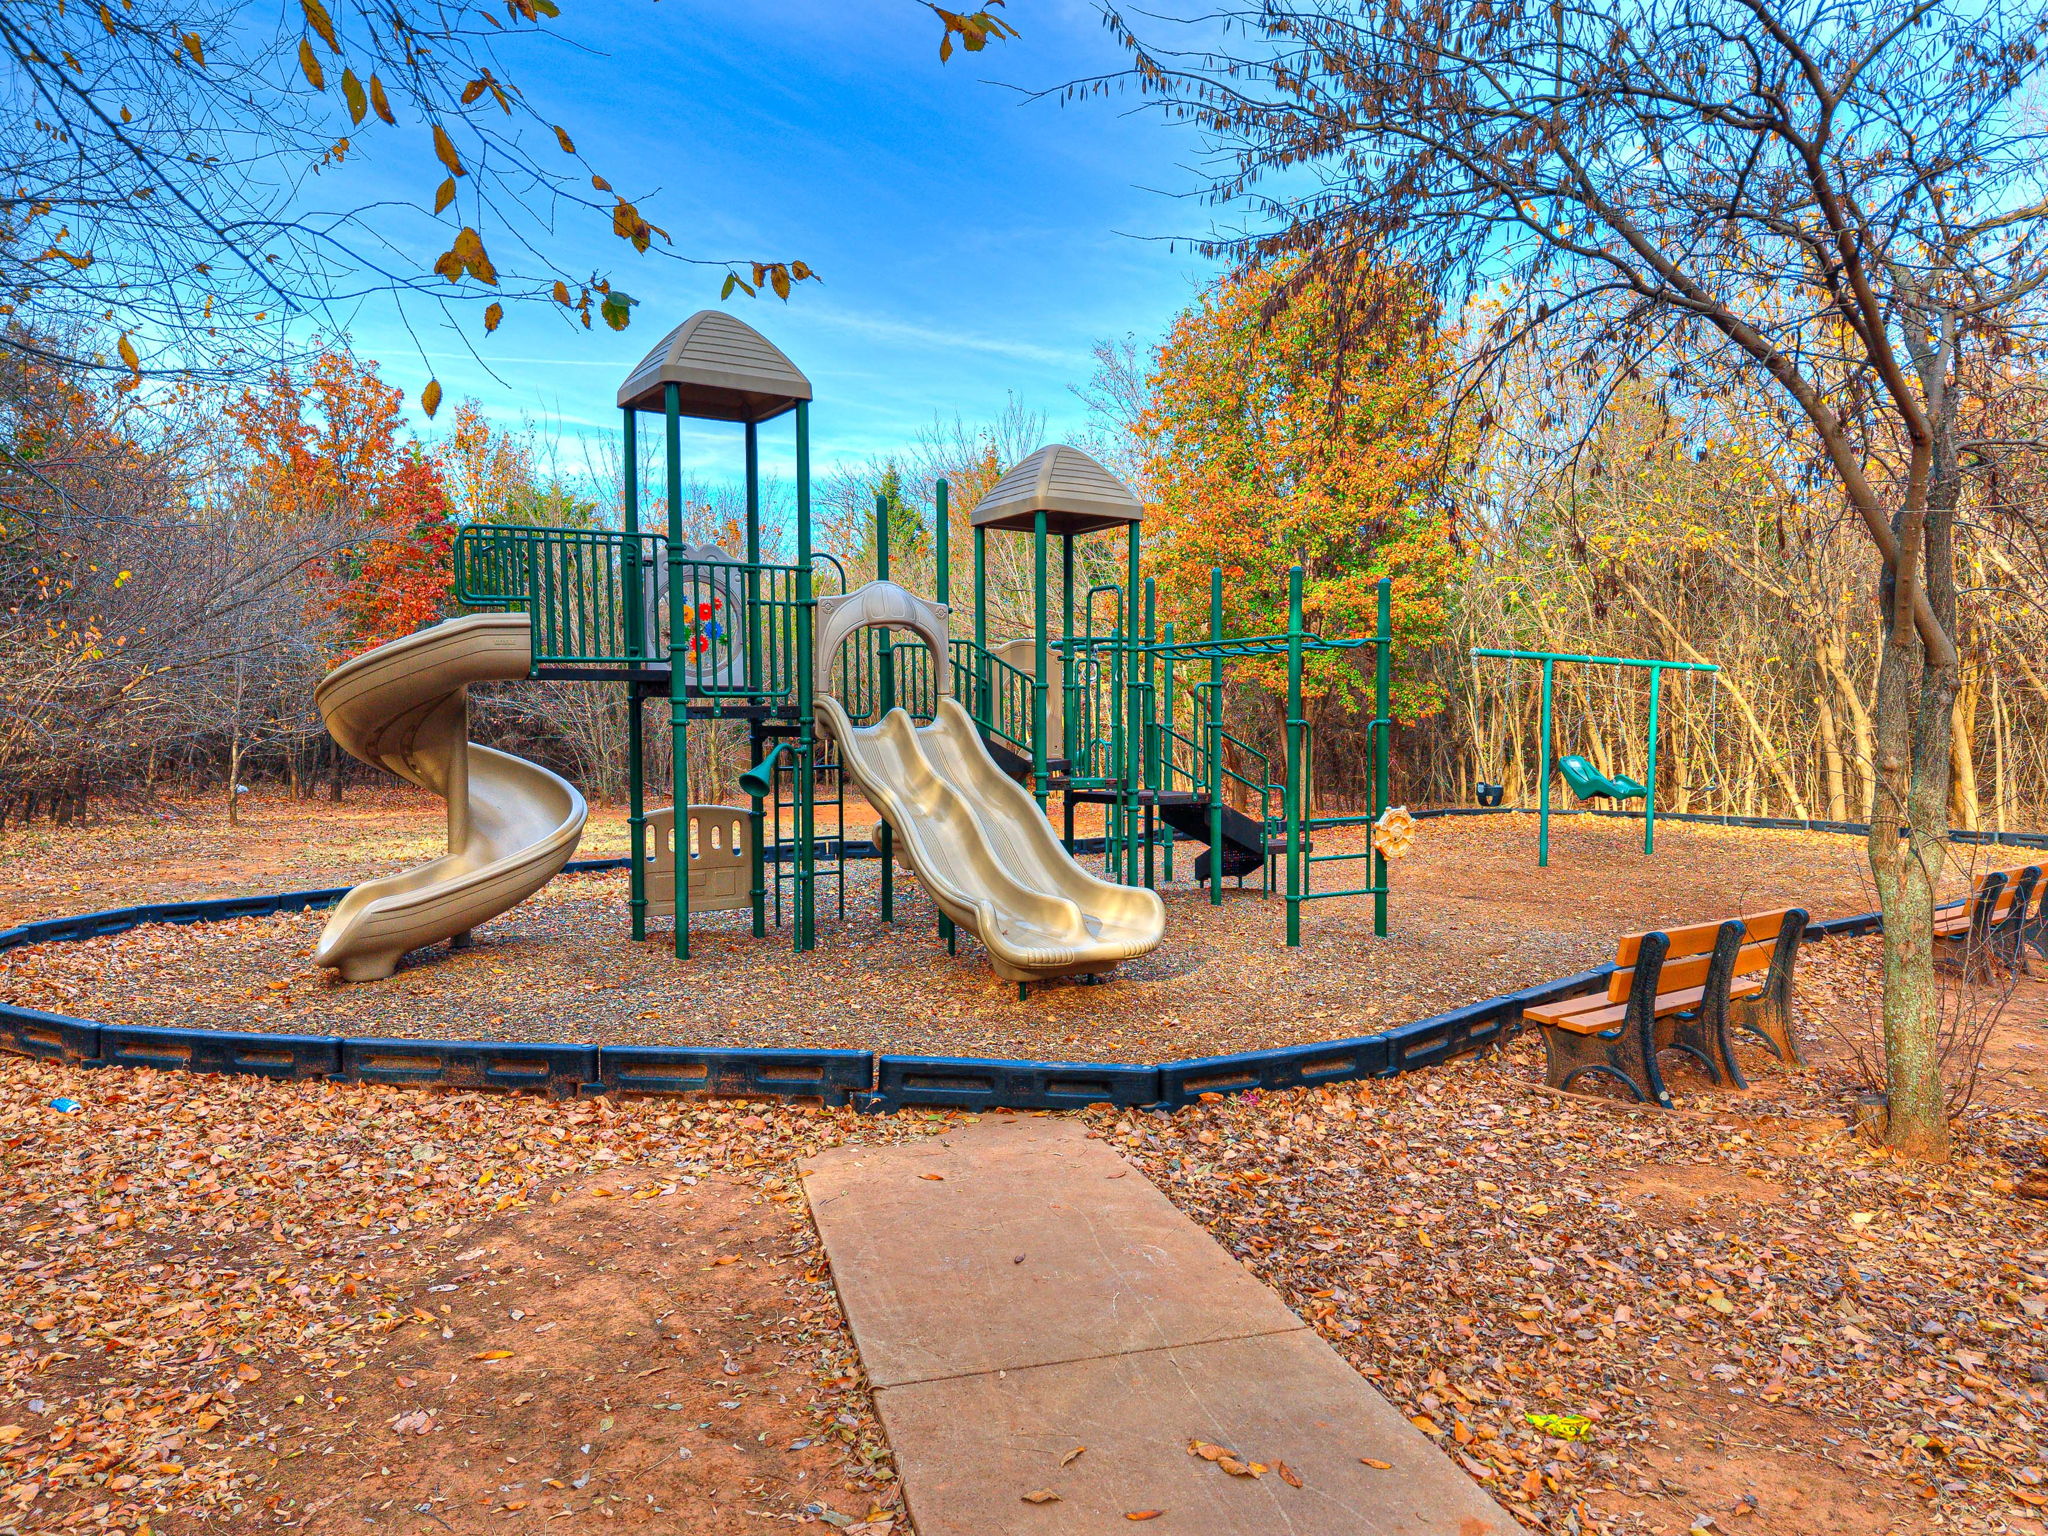
Both homes sit on premium 1-acre lots in Addington Farms — a community that offers space, privacy, and a tranquil setting while still being just minutes from shopping, dining, parks and easy access to Oklahoma City. With Deer Creek schools, these homes appeal to families who value quality education and long-term resale.
Whether you’re drawn to the ease of single-level living or the drama of a two-story designer home, Edmond’s market delivers rare options like these that combine premium acreage, thoughtful layouts, and lifestyle appeal.
👉 Interested in touring either home? Reach out to your local real estate expert or contact the listing agent for private showing details.